Governor Shumlin boasts that Vermont’s unemployment
rate is now merely 3.5 percent - acting as if he were somehow personally responsible for the improvement. Neither Shumlin,
nor the news media that “carry his water”, bother to consider what the figure represents, where it came from or
if it is truthful. The truth be told, they probably don’t know nor care!
.
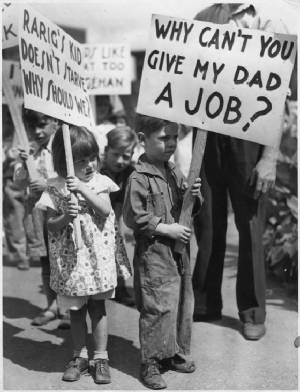
All
of us have friends and neighbors who have lost their jobs and have yet to find new employment. Many have been forced to cobble
together several part-time jobs, just to keep their “heads above water” until they are able to find a new full-time
engagement. Some will never find another job in the profession in which they have training and experience.
.
The Bureau of Labor Statistics (BLS) and Vermont’s Department of Labor (VTDOL) monitor
a wealth of statistical factors which in combination represent the condition of labor in Vermont. There is no simple “unemployment
rate” but a wide variety of factors that represent various aspects of the employment picture. The statisticians are
not to blame for the confusion; rather it is the politicians that “cherry pick” the figures for those that place
their political stars in the best light.
.
The
unemployment figure most frequently reported is the “U-3” rate a “middle-of-the-road” figure in a
range of conditions from “U-1” through “U-6”. The combined figures, referred to as the “Alternate
Measures of Labor Underutilization” produced by of the Bureau of Labor Statistics , represent an expanding expression
of the pool of unemployed workers. Vermont averages for
the period 2013Q2 through 2014Q1, the most recent numbers available.
U–1
Represents persons unemployed 15 weeks or longer, as a
percent of the civilian labor force - 1.8 % in Vermont.
U–2 Represents
those in the “U–1”count plus persons
who completed temporary jobs, as a percent of the civilian labor force - 2.3 % in Vermont.
U–3 Represents the total unemployed, as a percent of the civilian labor force - 4.3 % in Vermont. (3.5% for
June 2014)
U–4 Represents the total unemployed “U-3” plus “discouraged workers” (persons not currently looking for work because they believe no jobs are available for
them) as a percent of the civilian work force - 4.5 %
in Vermont.
U–5
Represents those in the “U-4” count plus all other “marginally attached workers” (persons who were not in the labor force,
but wanted and were available for work and had looked for a job sometime in the prior 12 months), as a percent of the civilian labor force - 5.2% in Vermont.
U-6 Represents those in the “U-5” count
plus those employed part-time for economic reasons (also referred to as involuntarily employed part-time) as a percentage
of the civilian work force - 9.1% in Vermont.
These figures do not include
individuals who have been unemployed for over 24 months and have given up looking for work –currently about 8,000 Vermonters.
In addition, the self-employed are not counted since they are ineligible for unemployment compensation and their work status
is difficult to track by BLS or VTDOL.
.
It is important to note that economists consider that
unemployment rates (U-3) below 4% represent “full employment” taking into account at this level the unemployed
are most probably: transitioning between jobs, training for advancement or on a voluntary hiatus from work.
.
Another accurate measure of employment is the “Labor Participation Rate” (LPR), this figure represents
the number of citizens over 16 years old who are employed as a percentage of the population. The most recent LPR figure (an
average for the twelve months ending December 31, 2013) for Vermont was 68.5%, the inverse of which informs us that 32.5%
or nearly 195.000 Vermonters were unemployed – a far different interpretation than the 3.4% or 11,200 represented by
the U-3 figure. While this figure is mitigated to some extent by retirees, who are no longer in the work force, about 80,000
according to a recent study by AARP. That same study indicates that many Vermont seniors have found it necessary to forgo
retirement for economic reasons - with 58.2% of men and 48.9% of women working beyond 65 here in Vermont.
.
The unemployment figures do not provide a complete picture of the labor situation in Vermont. Data from the VTDOL
indicate a continued decline in year-to-year figures in the “Goods Producing” employment sector. The number of
employees in this sector fell by 2.7% or 1,200 to a total of 43,200. Earnings fell for each category: Construction jobs by
-0.3%, Manufacturing by -1.3% and Durable Goods by 1.8% primarily as a result of a decline in available hours (Construction
-2.5%, Manufacturing -1.1, Durable Goods -1.6%). The “Service Providing” sector employment increased by an feeble
1.1% or 2,400 to a total of 243,200 during the same period with a modest increase in earnings moderated by a .3% reduction
in hours worked. The Government sector remained unchanged, however when Colleges and University employees
and Social Assistants are included the total increased by 600 to a total of 78,600 (earnings and hours are not tracked for
this sector).The governor brags
how he has masterminded the creation of 11,000 new jobs during his three years in office; what he is aware, of but fails to
mention, is that the state has lost 19,000 jobs during that same period – the net result is that 8,000 fewer Vermonters
have jobs today than three years ago.
.
Recent layoffs and closings announced by: Entergy (Vermont Yankee), Kennametal (Vermont Tap and Die), Plasan Carbon
Composites (automotive), Vermont Flexible Tubing and even the venerable Keurig/Green Mountain (coffee) represent the loss
of over 2,600 additional high paying Vermont jobs. The outlook over the next year is equally bleak as rumors fly of IBM’s
intentions to relocate their Essex Junction operations to the mid-west (or upstate NY) and military downsizing will certainly
result in reductions of the workforce at General Electric (jet engines) in Rutland.
..
CONCLUSION
While Vermont’s labor
picture is better than most of our neighboring states, the “rosy glasses” view of 3.4% unemployment, broadcast
by Governor Shumlin, does not present a true picture by any common sense measure. Vermont’s continuing decline in “Goods
Producing” jobs does not bode well for our economic future; while the increase in the Government – Education –Social
Service sector jobs foretells of increasing burdens for taxpaying employees and employers. Reducing the tax burdens on employees
and employers, while streamlining and simplifying regulations are far more important objectives for encouraging business and
job growth rather than concocting short term “fixes” where the state attempts to pick business “winners”
with special enticements financed by additional taxes on struggling Vermonters and Vermont businesses.
.
EPOLOGUE A political
humorist concludes a recent article with the punchline “Of course unemployment is down, they’ve all given up looking
for work!” There are cruel ironies in the fact that those who profess to be concerned for the unemployed are broadcasting
the news of “full employment” here in Vermont. Firstly, consider the unemployed Vermonters; who, for months or
even years, have submitted endless job applications, went on numerous interviews and regularly attended “job fairs”
–all in vain. The message that all-is-well on the job front must surely make these Vermonters, who are desperately seeking
work, feel isolated, worthless and dispirited. Secondly, consider potential employers who are looking to relocate or establish
a new venue for their business – surely the news of a small pool of able and willing workers in Vermont will discourage
them from considering our state and in turn deprive Vermonters of new employment opportunities.
.
The
Vermont Department of Labor’s statistical data was used in developing this story. Readers may access “Economic
and Labor Market Information” at: http://www.vtlmi.info/ The AARP WORKFORCE PROFILES: VERMONT data used in this story is available in PDF format at: http://www.aarp.org/content/dam/aarp/research/surveys_statistics/general/2013/workforceprofiles/AARP%20Workforce%20Profile%20-%20Vermont.pdf